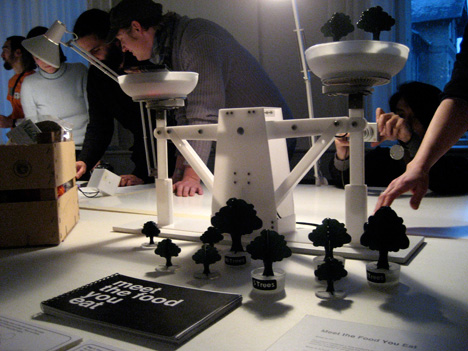
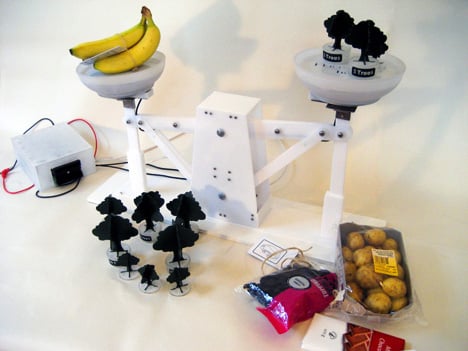
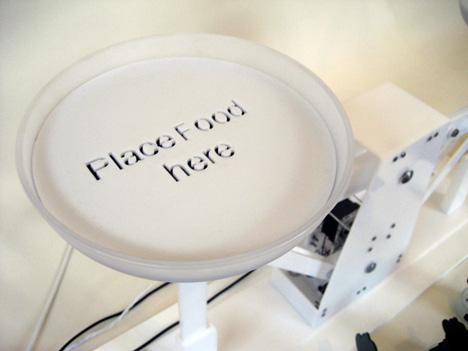
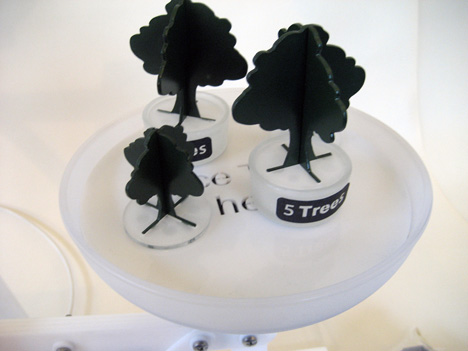
Meet the Food You Eat is a kitchen scale that measures the environmental impact of food. The scale works by looking at the carbon emitted by transporting a particular product from its country of origin to Denmark. Place an RFID tagged product on the appropriate arm and try to balance the scale with the tree shaped weights. The amount of trees used to balance the scale represents the number of actual trees it would take to offset that product’s carbon emissions over one year.
Designers: Adam Little, Eilidh Dickson & Siddharth Muthyala
This scale is an exploration in how tangible interfaces can be used to interact with data on the web. With the increase in usage of RFID technology and as “everday” objects become networked, we anticipate access to untold amounts of information for things as simple as an apple. With appropriate ways to interact with this data, we hope people will be able to make more informed decisions that will help build a sustainable world.
As an exhibition piece, this scale will raise questions about the food you buy, where it comes from and how it is transported. With a subject as complex as carbon emissions and the global food economy, our scale is only an entry point and is intended to raise more questions than it will answer.
This scale can also be viewed as a hypothetical kitchen appliance or point to a future grocery store service. The data it uses is important but remains hidden to most people, and we hope this will not be the case for much longer.
The student design team faced many challenges in assembling the scale and in gathering the data behind the products, but most of our key learnings came in the beginning of the project. Rapid prototyping and user testing were essential for our team. We learned that building rudimentary models is the best way to test rudimentary ideas. Some models told us when an idea was going in the wrong direction while other models told us this only when in the hands of people outside our team. From the beginning, our project was heavy with metaphors – a scale and weights to measure data, and trees to represent this data. User testing was the only way to know if these metaphors were the right choice.